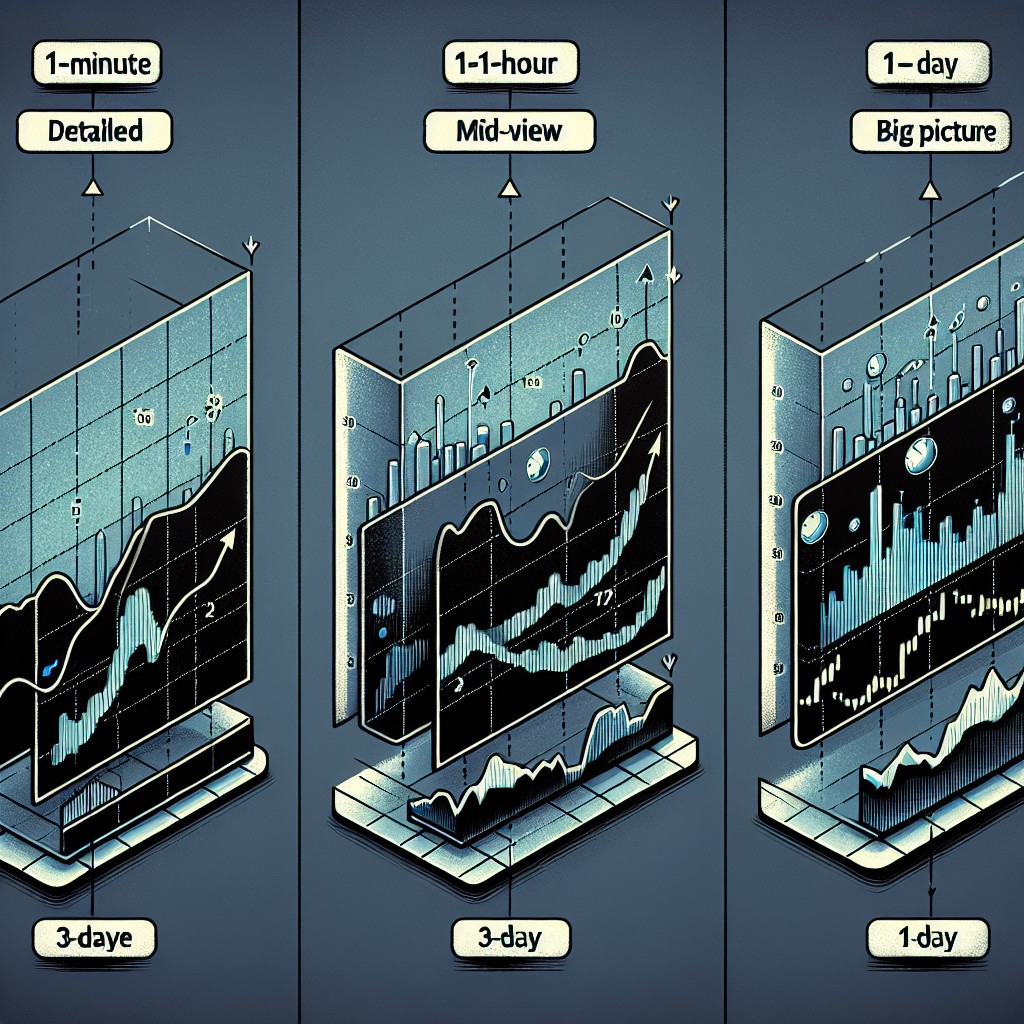
Chart Timeframes "A comparative diagram explaining 'Chart Timeframes' like zooming on a map. Show three small, sequential chart panels: '1-Minute (Detailed)', '1-Hour (Mid-View)', and '1-Day (Big Picture)'. As the view moves from 1-Minute to 1-Day, the price movement line should visually become smoother to illustrate the loss of small details. Use a soft dark background with clean labels and arrows, maintaining a modern, minimalist, and educational aesthetic suitable for a financial audience."
تولید تصویر با هوش مصنوعی ایرانی؛ ساختهشده با شهرزاد
سازنده: Azitta
۲۵,۱۷۷ تصویر با شهرزاد ساخته شده
تو هم همین الان تصویر خودت رو بساز و یا ویرایش کن
حساب دارید؟ وارد شوید
تصاویر دیگر Azitta
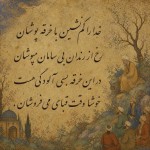
ی عکس با پشت صفحه مینیاتوری میخوام که شعر ؛خدا را کم نشین با خرقه پوشان رخ از رندان بیسامان مپوشان در این خرقه بسی آلودگی هست خوشا وقت قبای می فروشان. رو روش با خط شکسته نستعلیق نوشته باشه ، شعر ترجیحا روی پس زمینه باشه و نه در کادر جدا
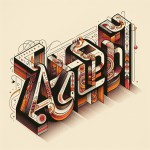
برای کلمه:" آزاده" یک طراحی اسم یا تایپوگرافی انجام بده
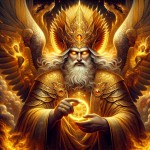
الهه سپنتا مینوی خردمند الهه باستان ایرانی

تصویر واضح تری از چهره الهه سپنتا مینوی خردمند بمن بده که تنگ آبی در دستش نباشد